If you ask almost any longtime investor if the stock market can be volatile, they would say, “Yes.” They may also tell you to “Ignore short-term market fluctuations” and “stay focused on the long term.”
Good advice. But that is the logical part of their brains talking. Unfortunately, we don’t always act using the logical parts of our brains.
This can be true when markets get rough, like in 2022, 2020 or 2008. Our emotions tell us to sell, often at the wrong time. This can also be true when markets are doing well. We see strong returns and want our piece of the gains. This is known as Recency Bias. We see how the market has done over the last 6-12 months and instinctively assume that will continue going forward.
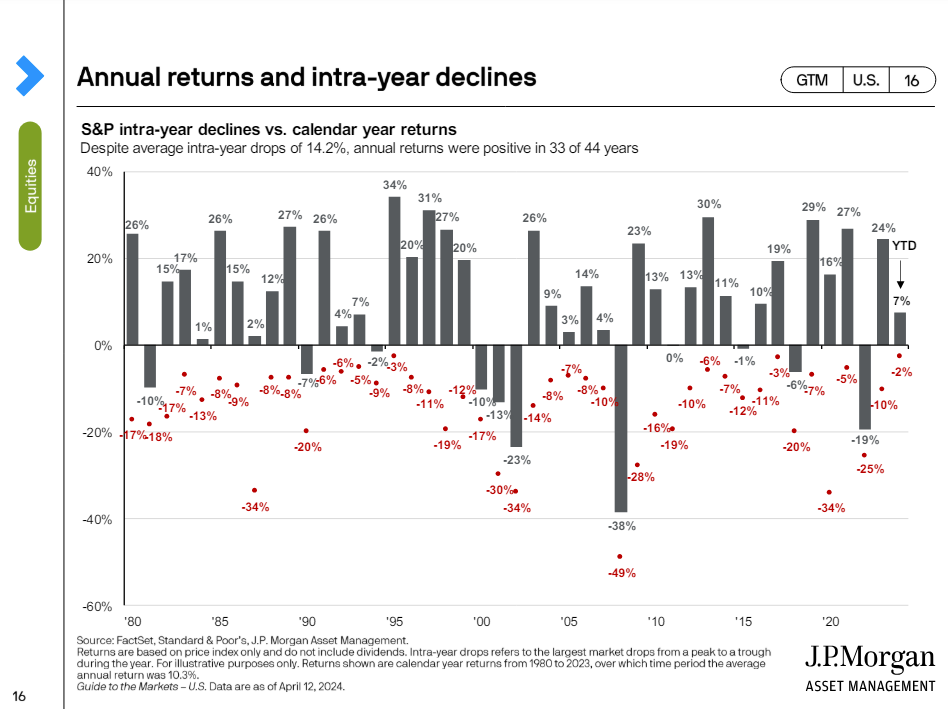
It’s time for our occasional reminder that the stock market does not go up in a straight line. Yes, it goes up more often than it goes down and over time it yields the kinds of returns we all strive for. But there are bumps along the way, and those bumps happen often.
Our clients have seen the chart below many times over the years. It serves as a great reminder of this concept of market volatility from year to year. This chart shows us that on average, the S&P 500 sees a price decline of 14% in any given year. The market sees declines greater than 5% three times in an average year. (Source: JPMorgan Guide to the Markets)
That may not be too surprising to hear, but considering the lack of volatility we’ve seen and rapid rise since October of last year, our Recency Bias can lull us into forgetting this reality.
This doesn’t mean you shouldn’t stay invested. It also doesn’t mean you should try to time market downturns. But we should remember that market returns don’t come for free; volatility is the price of admission. Market declines are a normal thing, as we can see. When the next market decline inevitably happens, the media will make it seem like it’s the end of the world.
It’s not. It is just the market doing what it does. Let’s not be surprised by it, but rather prepared for it.


